Our team has noticed that asking how much should a small business spend on digital marketing in 2026 is the crucial first step for serious planning. Every time budgeting season rolls around, the most common question in the boardroom is how to right-size your marketing spend without starving your growth. The shift away from legacy advertising has made digital spending a mandatory utility for companies across Southwestern Ontario.
We often see that relying on vague industry rules leads to chronic underfunding.
The reality is that tying your budget directly to top-line gross revenue provides the most predictable engine for lead generation. This alignment prevents you from pulling back funds just when your campaigns start gaining momentum. We will break down the exact percentage allocations that actually work in the Canadian market, and then map out a clear channel-by-channel strategy.
The General Benchmark: How Much Should a Small Business Spend on Digital Marketing in 2026?
Setting a budget based on net profit is a common mistake that severely limits growth. A much safer approach is to use gross revenue as your baseline. We rely on recommendations from the Business Development Bank of Canada (BDC), which advises small businesses to allocate between 5% and 10% of their gross revenue to marketing.
Recent 2026 data from the CMO Survey indicates the average marketing budget has stabilized at 9.4% of company revenue. This financial alignment is crucial for scaling your operations predictably. We see B2B companies typically thriving at the 5% to 8% mark, while consumer-facing startups often push closer to 12% to 15% to capture market share.
| Business Stage | Typical Revenue Allocation | Primary Focus |
|---|---|---|
| Established (Steady Growth) | 5-10% | Brand retention and steady lead flow |
| Growth-Stage (Aggressive) | 10-20% | Market share acquisition and scaling |
| New Business (Years 1-3) | 12-20% | Brand awareness and initial customer base |
At an 8% allocation, a business generating $500,000 in annual revenue would budget $40,000 per year, which breaks down to roughly $3,300 per month. A company generating $1 million in revenue at the same percentage would have $80,000 annually, or about $6,700 per month. We often use these specific revenue figures to demonstrate the math during strategic planning sessions.
A company with strong word-of-mouth referrals might easily sustain itself at a 5% allocation. A business entering a highly competitive territory might need 15% to gain any meaningful traction. We always treat these benchmark figures as starting points rather than rigid laws.
Breaking Down the Budget by Channel
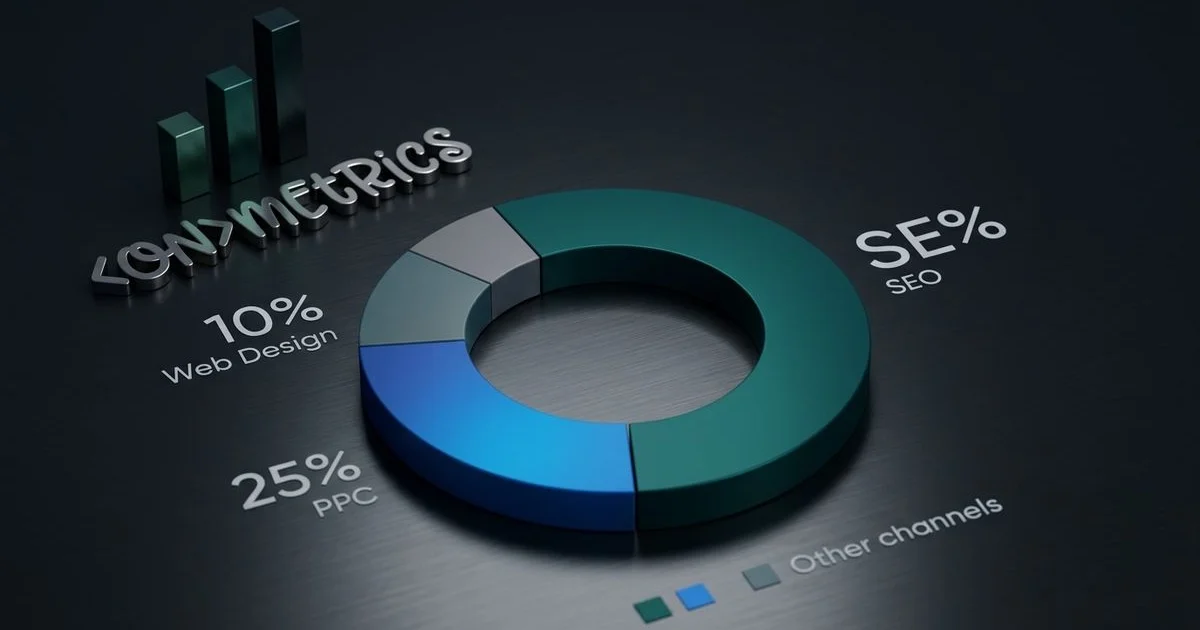
Distributing your digital marketing spend requires balancing short-term lead generation with long-term asset building. The following allocations represent a healthy mix for local operators in Southwestern Ontario. We frequently help clients slice up that total monthly figure once it is established.
Search Engine Optimization (SEO): 25-35% of Budget
Mid-tier SEO retainers in Canada typically range from $1,000 to $2,500 CAD per month according to 2026 industry pricing studies. This channel compounds over time, meaning the content and authority built today continues generating traffic for years after the initial work. Our data indicates that SEO remains the highest-ROI long-term investment for most local businesses.
A meaningful investment covers technical optimization, local citation management, and authoritative link building. This level of research reveals exactly what search terms competitors are winning, allowing you to capture that specific traffic. We rely on advanced software like Ahrefs to perform technical audits and keyword gap analysis.
- Technical Optimization: Ensuring fast load speeds and mobile responsiveness.
- Local Citations: Managing accurate directory listings across Canada.
- Authoritative Link Building: Securing mentions from relevant industry websites.
A well-executed strategy often becomes the most cost-effective lead generation channel within 12 to 18 months. For a detailed look at what that strategy involves, you can read our comprehensive SEO guide. Our team ensures that what you get for your SEO spend accumulates rapidly.
Pay-Per-Click Advertising (PPC): 25-40% of Budget
WordStream benchmarks for 2026 show the average cost per click across industries is roughly $5.26, though Canadian local markets often see rates between $1.66 and $2.50. Unlike organic search, results start the exact moment your campaigns go live. We leverage PPC, primarily Google Ads, to deliver immediate visibility and leads for local service providers.
Typical ad spends vary widely by industry and local competition. The professional workaround is building extensive negative keyword lists to block people searching for free or cheap solutions. Our most successful campaigns avoid using Google’s default Smart Campaigns because they often waste funds on broad, irrelevant searches.
- Service businesses: Plumbers, electricians, and lawyers typically spend $1,500 to $5,000 monthly in ad spend, plus a management fee.
- Retail and ecommerce: Online stores usually range from $1,000 to $3,000 monthly.
- Professional services: Accountants and consultants generally allocate $1,000 to $3,000 monthly.
A campaign spending $3,000 a month that generates $15,000 in revenue is a 5:1 ROAS, which is vastly superior to a $1,000 campaign returning 2:1. You can learn more about the exact mechanics of building profitable PPC campaigns. We evaluate success based on your return on ad spend (ROAS) rather than the total budget.
Web Design and Development: 10-15% of Budget (or Amortized)
Every search ranking, paid click, and social post exists to drive traffic back to this single asset. If that site fails to convert visitors, every dollar spent on external channels is partially wasted. We consider your website to be the central hub of your entire digital ecosystem, which is why investing in professional web design is so critical.
A 2026 forecast indicates that a strategy-driven custom website in Canada costs between $5,000 and $10,000 CAD. Google heavily penalizes slow load times, and a site taking longer than three seconds to load will experience massive bounce rates. Our audits frequently reveal that ignoring Core Web Vitals is a massive conversion killer.
- Initial Build: $5,000 to $10,000 as a one-time project, amortized over 3 to 5 years. This adds roughly $140 to $275 per month to the budget.
- Ongoing Optimization: $500 to $1,500 monthly for conversion rate improvements, security patches, and speed monitoring.
- Platform Fees: Basic hosting and domain renewals usually run $50 to $100 per month depending on traffic volume.
Content Marketing: 10-20% of Budget
Most Canadian businesses currently budget $1,500 to $3,000 CAD monthly for this channel. High-quality articles, case studies, and video guides attract traffic while establishing deep industry expertise. We use content marketing to serve both organic search objectives and long-term lead nurturing.
This structure involves publishing one massive, authoritative guide as the hub, and several shorter, related articles that link back to it. This specific linking method signals strong topical authority to search engines. Our strategy often involves creating a Hub and Spoke content model.
A varied mix of content gives you excellent material to share across email and social platforms. This approach typically includes a few key formats that build brand awareness. We suggest budgeting for a consistent publishing cadence of four to six well-researched blog posts per month.
- SEO Articles: Long-form blog posts targeting specific search queries.
- Case Studies: Detailed breakdowns of successful client projects.
- Video Guides: Short, engaging clips for social media distribution.
Early investments continue to generate traffic long after the initial publication date. High-quality assets separate authoritative brands from generic competitors. We treat this ongoing content production as a compound interest account for your digital presence.
Analytics and Attribution: 5-10% of Budget
Operating without proper tracking means making financial allocation decisions based on incomplete or biased data. Modern tools like Google Analytics 4 (GA4) use data-driven attribution to map the entire customer journey across multiple touchpoints. We see analytics as the most frequently skipped line item, yet it is the tool that makes every other dollar highly effective.
Seeing exactly which channels generate actual revenue allows you to shift spend from underperforming areas to high-yield winners. Proper attribution software can improve marketing ROI by 15% to 30% simply by eliminating wasted ad spend. Our team at ONmetrics consistently notices that businesses investing in proper data visualization and attribution make measurably better decisions.
This tier of investment covers several essential data tracking components. Transparent data is the only way to scale a business predictably. We recommend allocating $500 to $1,500 a month for analytics software and professional reporting.
- GA4 Configuration: Setting up customized events and conversion goals.
- Call Monitoring: Tracking which specific campaigns generate phone calls.
- Multi-Touch Attribution: Using advanced platforms like ONclix to map the full customer journey.
How to Prioritize with a Limited Budget
Starting with a limited pool of capital requires a highly focused approach. Spreading a small budget too thin guarantees that none of your campaigns will generate enough momentum to succeed. We understand that not every business has $5,000 a month to spread perfectly across multiple channels.
| Monthly Budget | Strategic Priority | Expected Outcome |
|---|---|---|
| $1,000 - $2,000 | Single Channel Focus (SEO or PPC) | Slow organic growth or immediate, limited paid leads |
| $2,000 - $4,000 | Blended Strategy (60% Primary, 40% Secondary) | Consistent lead flow with measurable tracking |
| $4,000 - $8,000 | Diversified (SEO, PPC, Content, Analytics) | Scalable growth across multiple digital touchpoints |
| $8,000+ | Full-Funnel Dominance | Maximum market share and advanced conversion rate optimization |
This free local listing is often the highest converting asset for service-based businesses in their first year. Once a baseline of revenue is established, you can graduate to the higher tiers and introduce paid ads. We always advise companies in the under $1,000 tier to focus heavily on optimizing their free Google Business Profile.
London Ontario Market Considerations
London has experienced significant population growth, bringing an influx of new businesses competing for local search visibility. Sectors like home services, legal, dental, and real estate are fiercely competitive within the London Census Metropolitan Area (CMA). Our local footprint gives us a clear view of the specific dynamics impacting Southwestern Ontario right now.
This affordability means a strictly managed PPC budget can stretch much further, making it an excellent acquisition tool. The surrounding region offers a unique advantage for service area businesses. We have noted that local cost-per-click rates remain moderate compared to saturated markets like Toronto or Vancouver.
- Kitchener-Waterloo: A booming tech corridor ideal for B2B targeting.
- Woodstock: A strong manufacturing hub with high demand for industrial services.
- St. Thomas: A rapidly growing residential market perfect for home service providers.
Serving multiple cities allows a single content strategy to capture traffic across several local markets. This geographic spread effectively multiplies the return on your initial content investment. Our campaigns often target these communities simultaneously to maximize reach.
The Most Important Rule
Setting a budget is only the first step in the process. Before increasing your spend on any specific channel, you must verify that the tracking infrastructure is flawless. We firmly believe that the worst marketing budget is one spent without any mechanism to track the actual financial return.
Knowing your numbers ensures every future decision is grounded in profitability. A measured, data-driven approach removes the anxiety from business expansion. We want you to feel confident in asking how much should a small business spend on digital marketing in 2026.
Clear analytics and smart allocations are the keys to dominating your local market. If you would like to discuss what an appropriate strategy looks like for your specific situation, get in touch with ONmetrics. We are always ready to help you build a strategy that delivers measurable, revenue-driven results.