

Why this industry exists
A growing share of product research no longer happens on a search-results page. Someone who used to type "best CRM for a small business" into Google and scan ten blue links now asks ChatGPT, Gemini, Claude, or Perplexity and reads a paragraph that names four or five products, often with no links at all. For a brand, this is a discovery channel it cannot see. There is no Search Console for the inside of a language model — no dashboard from OpenAI or Google telling a company how often it gets recommended, to whom, or in what light.
So an industry grew up to sell that visibility back to the brands. It travels under several names — AI visibility tools, AI search visibility tools, LLM visibility tools, ChatGPT rank trackers, AI rank trackers, LLM brand monitoring, Answer Engine Optimization (AEO), Generative Engine Optimization (GEO), and AI share-of-voice measurement — but the product is always a version of the same promise: we run thousands of prompts through the AI engines, measure how often and how prominently your brand appears, track it over time, and tell you how to appear more.
By mid-2026 this was a real market. Independent dataset compilations put it at roughly 80 companies and about $1.5 billion in venture capital 1, spanning AI-native startups (Profound, Evertune, Peec AI, AthenaHQ, Otterly.AI, Rankscale, Scrunch, and many more) and incumbent SEO suites that bolted on AI modules (Semrush, Ahrefs, Conductor, seoClarity, Similarweb).
AI visibility tools vs. GEO, AEO, and AI SEO tools
The search market uses overlapping names. Generative engine optimization, answer engine optimization, AI search optimization, and AI SEO tools usually describe the optimization side: how to get cited, mentioned, or recommended by AI systems. AI visibility tools, LLM visibility tools, ChatGPT rank trackers, and AI rank trackers describe the measurement side: whether that visibility is actually happening. This study focuses on the measurement side because the score has to be trustworthy before the optimization advice can be trusted.
A July 2026 Search Engine Land / Fractl study makes the premise stronger, but more nuanced: search demand is redistributing rather than simply disappearing. Their analysis of 1,010,848 high-volume keywords found large declines in some non-branded, information-heavy query sets, offset by growth elsewhere, and survey evidence that AI mentions can still send buyers to brand sites. That supports this study's framing: AI visibility is not a replacement for SEO. It is an added discovery layer where brand mentions can either trigger the next search or bypass it entirely 15.
This article explains how these tools actually work — the real pipeline under the dashboard — and then confronts the problem sitting at the center of the whole category: the thing they measure does not hold still, and the companies measuring it mostly won't tell you how they do it. To put hard numbers on that instead of asserting it, I ran three experiments totaling 740 live calls to current models. They are woven through the second half.
Part 1 — The pipeline, stage by stage
Underneath every AI-visibility product, however it's marketed, is the same six-stage pipeline. Here is what happens at each stage — and, more importantly, the decision inside each stage that silently determines the output.
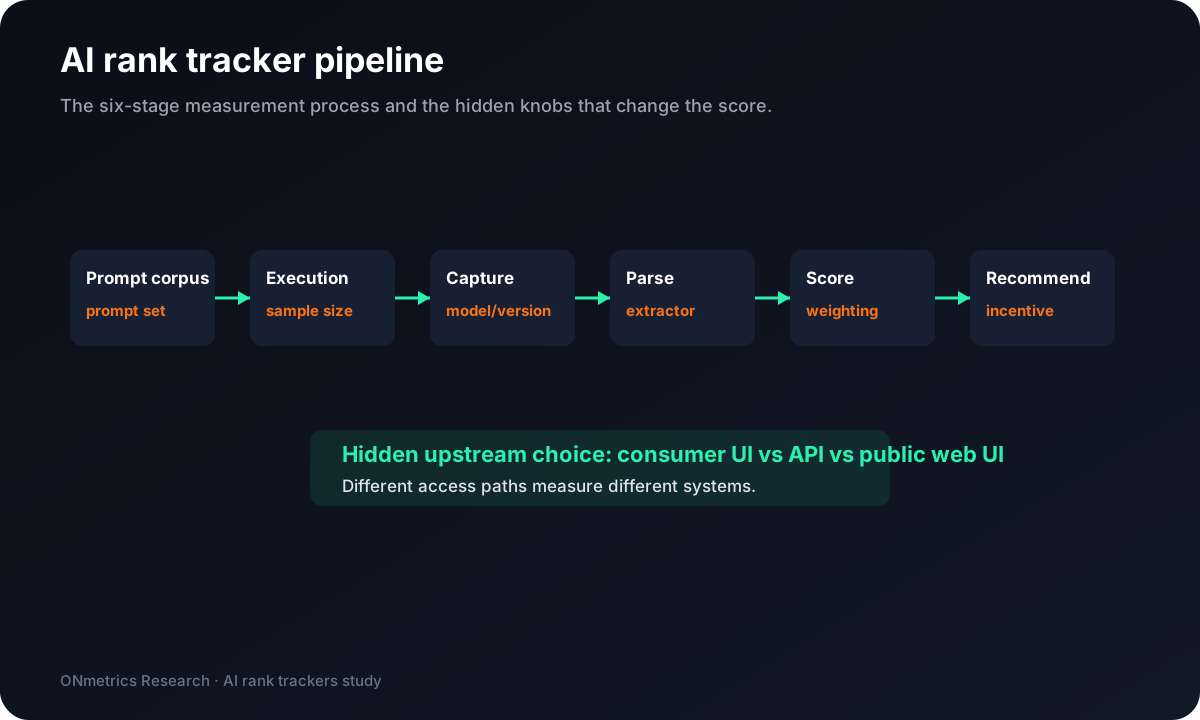
The choice before stage one: how do you get the model's answer?
Before any prompt is written, a tracker has to decide how it will obtain an AI engine's answer. This is the single largest hidden variable in the entire field, and there are three incompatible ways to do it 2:
- (A) Consumer-interface capture. Automate the actual ChatGPT / Perplexity / Gemini / Copilot web app (or license real-user session data), so you measure what a logged-in human actually sees — including UI-only artifacts like citation cards, live web grounding, the app's hidden system prompt, and personalization. Profound is explicit that it captures "the consumer experience, not API outputs"; this is also the architecture feeding third-party data into the incumbents. It's the most faithful to reality and the most fragile — brittle to UI changes and generally against the engines' terms of service.
- (B) Base-model API. Call the provider's developer API directly. Reproducible, parameterizable, stable — and not what users see. The API has a different system prompt, usually no web grounding by default, and different tool behavior. Evertune and Conductor argue for this path explicitly.
- (C) Programmatic public web UI. Script queries through the free, logged-out public interface, which typically serves an older pinned model with a fixed knowledge cutoff. Ahrefs' Brand Radar and many budget tools work this way.
The consequence is the thing to internalize: an "AI visibility score" from a consumer-capture tool and one from an API tool are not the same measurement, and there is no conversion factor between them. They measure three different systems that happen to share a brand name. Almost no vendor foregrounds which one they use. This is the first question a buyer should ask, and the one least often answered.
Stage 1 — Prompt corpus construction
The tracker builds the universe of questions it will ask. This "prompt set" is the biggest methodological choice the customer never sees, because it defines the entire population being measured. Three common approaches 3:
- LLM-expanded seed topics — start from a few themes and have an LLM generate natural-language prompts, varied by persona and by funnel stage (awareness → consideration → decision).
- Search-data-anchored — derive prompts from real search-keyword databases and "People Also Ask" data, so visibility can be weighted by genuine query volume rather than invented questions.
- Branded vs. non-branded (aided vs. unaided) — a crucial split. A prompt that names your brand ("what do people say about Acme?") measures something completely different from one that doesn't ("what's the best widget?"). Non-branded prompts are where discovery actually happens, and they're harder to get right.
Whoever writes the prompt set decides who can possibly win. A brand strong in "enterprise" queries and weak in "cheap/free" queries will look dominant or invisible depending purely on which prompts the vendor chose — a framing choice presented to the buyer as an objective score.
Stage 2 — Execution & sampling
The prompts are sent to the engines, on a schedule. The decisive parameter here is how many times each prompt is run (and how often the schedule repeats, to catch model drift). As the experiments below show, this single number — the sample size per prompt — determines whether the resulting "visibility rate" is a real measurement or a coin flip. It is also the parameter vendors disclose least.
Stage 3 — Capture
The full response is stored, ideally with metadata: which model, which version, the timestamp, whether web grounding was active, and any citations or links. The quiet failure here is not logging model version and grounding state. Providers update models silently; a "trend" in your score across weeks can be an artifact of the engine changing underneath the tracker, invisible unless version is captured.
Stage 4 — Parse & extract
The brand mentions are pulled out of the prose. This is harder than it sounds, because answers are free text, and the extractor has to distinguish a genuine recommendation ("I'd suggest HubSpot") from a citation source ("according to Forbes"), from UI chrome, from a hypothetical aside. Approaches range from named-entity recognition and regex to an LLM acting as judge. Extractor accuracy — and especially the false-negative rate, brands that were named but missed — directly scales every downstream number, and is essentially never published. (My own experiments below ran into exactly this: one current model returned reasoning-scratchpad text instead of an answer more than half the time via API, which a naive extractor silently miscounts.)
Stage 5 — Metrics & scoring
The extracted mentions are aggregated into scores. This is where prose gets turned into a number, and where the vocabulary matters most:
- Presence rate (a.k.a. visibility) — the fraction of prompt-runs in which the brand appears at all.
- Share of voice — the brand's mentions divided by all brand mentions in the category.
- Average position / prominence — where in the answer the brand appears, since being named first is worth more than being named eighth.
- Citation share — the brand's domain as a fraction of all cited links.
- Sentiment — the tone of the mention, usually LLM-judged.
The weighting formula that turns "mentioned third" into a score is proprietary at most vendors, but a few publish theirs, and they reveal the shared logic 4:
- Evertune's AI Brand Score weights position geometrically: 1st place = 100%, 2nd = 90%, 3rd = 81% — each step is 90% of the previous (a 0.9ⁿ decay).
- Peec AI defines visibility as "the percentage of AI responses that mention your brand," share of voice as the brand's mentions over all brands' mentions, and position as the average ranking.
These commercial formulas are close cousins of the academic state of the art. The seminal GEO paper (Aggarwal et al., KDD 2024) 13 defines a brand's "impression" from three building blocks: a word-count impression (the normalized share of answer words in sentences citing the source), a position-adjusted word count that multiplies by an exponentially decaying function of citation position (motivated by search click-through following a power law with rank — the same intuition as Evertune's geometric decay), and a subjective impression scored by an LLM judge (G-Eval) across seven facets: relevance, influence, uniqueness, subjective position, subjective count, click-likelihood, and diversity. The industry's scoring math, in other words, is real and traceable — where it's disclosed. The problem is how rarely it is.
Stage 6 — Recommendation
Finally, most vendors bolt on advice: which pages, domains, and content types to influence, because LLM citations lean heavily on particular sources (review sites, Reddit, Wikipedia, comparison articles, documentation). This is the "optimization" half of GEO — and, as we'll see in Part 6, it is also where the industry's central conflict of interest lives, because the same firms increasingly sell both the measurement and the fix.
Part 2 — The core problem: what they measure doesn't hold still
Here is the fact the entire industry is built on top of, and mostly declines to put on the front page: ask the same AI engine the same question twice, and you get two different answers. Not unrecognizably different — the same handful of famous brands tend to recur — but different enough that any precise "rank" is partly an artifact of which run you happened to sample.
Independent work had already pointed here. SparkToro's roughly 3,000-prompt study found AI platforms produce identical brand recommendations less than 1 time in 100, and identical ordering less than 1 in 1,000 14. A separate analysis of 3.7 million AI citations found 91% of cited URLs appeared in only one LLM 14 — meaning citation scores from different engines can't be meaningfully averaged. And the analyst Kevin Indig, summarizing related research, put it plainly: run the same prompt five times, and only about 20% of brands show up consistently 14.
I wanted to measure this directly on current models rather than rely on secondary reports, so I ran three experiments. All three, and their raw data, ship with the full report.
Experiment 1 — 400 live API calls
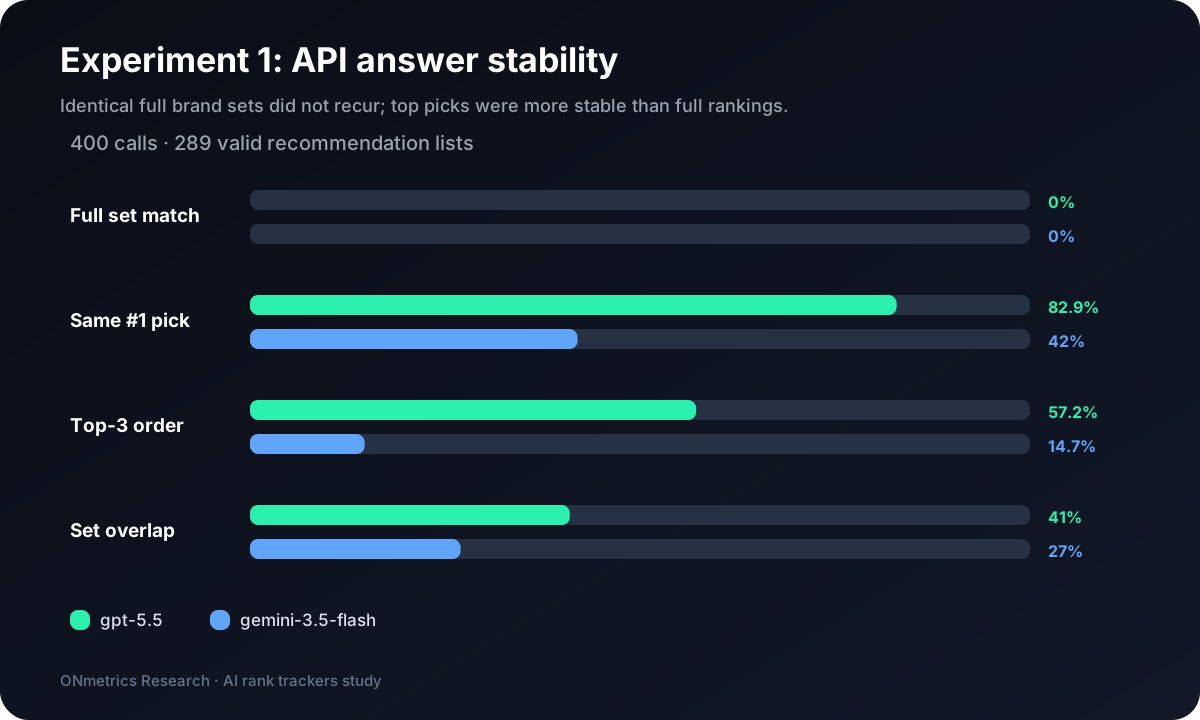
Design. 20 commercial "best X" prompts (CRM, password managers, VPNs, project management, cloud storage, help desk, e-signature, and more), sent to two current flagship models — gpt-5.5 and gemini-3.5-flash — 10 times each, ungrounded, through the API. 400 calls, $6.33. From each answer I extracted the ordered list of recommended brands, then asked: how often does the identical prompt give the identical result?
A finding hiding in the data quality. Of the 400 responses, only 289 were valid recommendation lists; 111 were not — and the exclusions were almost entirely on the ChatGPT side: gpt-5.5 returned reasoning-scratchpad text ("Considering password-manager options I need to…") instead of an actual answer on 81 of 200 calls, plus 19 empty/errored and 11 single-fragment replies. Gemini returned a clean list all 200 times. This is itself the Stage-4 false-negative risk made concrete: a current flagship model, via API, fails to produce a usable answer more than half the time, and a tracker that doesn't catch this silently miscounts it. (An earlier version of my own analysis was fooled by exactly this and had to be corrected — a cautionary tale about extractor quality.)
The results, on the clean 289:
| Metric | ChatGPT gpt-5.5 | Gemini 3.5-flash |
|---|---|---|
| Identical full brand set across two runs | 0.0% | 0.0% |
| Same #1 brand across two runs | 82.9% | 42.0% |
| Identical top-3 in order | 57.2% | 14.7% |
| Mean pairwise set overlap (Jaccard) | 0.41 | 0.27 |
The identical full brand set recurred 0% of the time on both models — the list reshuffles on every single call. The one thing reasonably stable is the top pick. Everything below the #1 slot is largely noise: "Breezy HR" ranged from 1st to 11th across ten identical Gemini runs, so any "average position" for it is an average over a distribution the vendor never shows you.
And the two models barely agree with each other: answering the identical question, gpt-5.5 and Gemini shared only about 9% of their recommended brands (mean Jaccard 0.09, range 0.05–0.14). A cross-engine "visibility score" that blends ChatGPT and Gemini is averaging two systems that overlap almost not at all.
Experiment 2 — 180 runs across the consumer engines
The API is not what consumers see, so I extended the test to the actual consumer interfaces: Claude (ungrounded), Perplexity (grounded), and Microsoft Copilot (grounded), 20 prompts, 3 repeats each — 180 runs, brands re-extracted from the raw answer text by an LLM judge instructed to keep recommended products in order and reject citation sources and UI chrome. This time I held to the standard the industry doesn't: every rate reported with a bootstrap confidence interval.
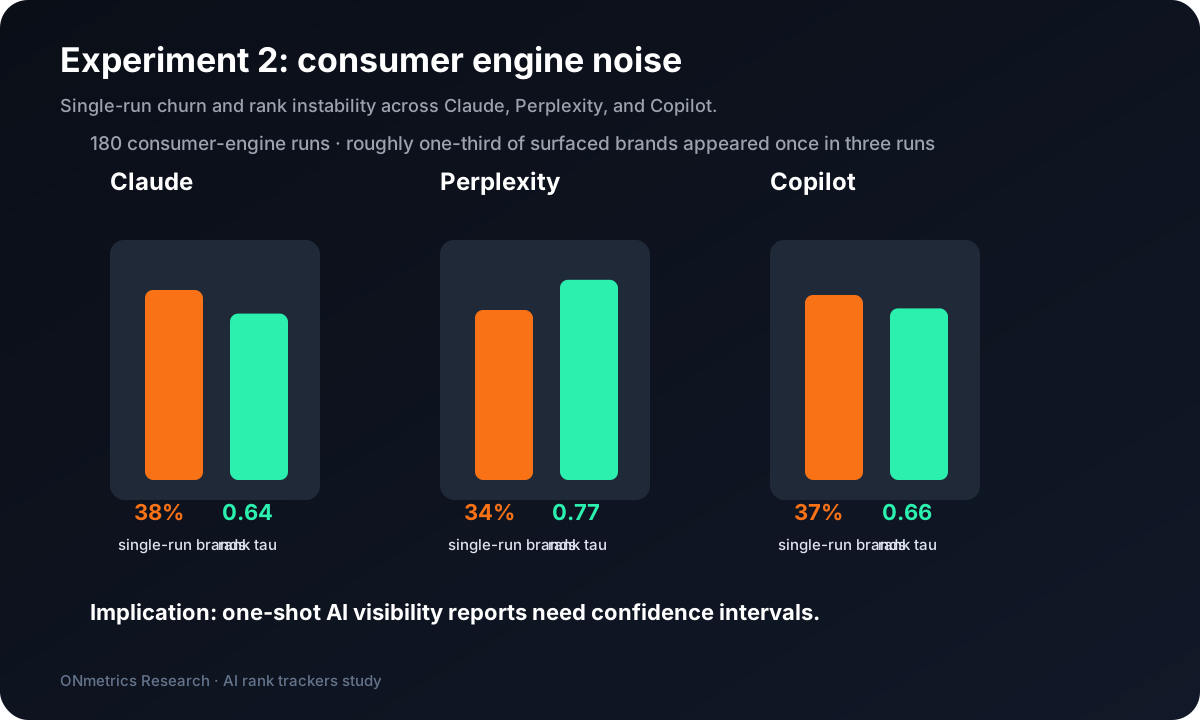
Four findings, each with a number and a confidence interval behind it:
- The identical answer essentially never recurs. Identical full set: 0% (Claude), 0% (Perplexity), 10% (Copilot). Same conclusion as the API run, on a completely different measurement path.
- About a third of what a tracker surfaces is single-run noise. Of every brand that appeared at all in a prompt, 34–38% appeared in only 1 of 3 runs (Claude 38%, Perplexity 34%, Copilot 37%) — present once, gone the next two times. A dashboard that samples each prompt once hands you a list where roughly a third of the entries wouldn't reappear on a re-run.
- Statistically valid measurement needs ~80–100 samples per prompt. A power analysis (Wald interval, ±10 percentage points, 95% confidence) says a mid-range brand at 30% presence needs about 81 repeats; a 50% brand needs 97. Vendors typically sample once; the highest disclosed sampling I found anywhere in the industry is around 100 (Evertune). Most tools report presence rates whose error bars are wider than the week-to-week movements they flag as "trends."
- Even the survivors don't hold their order. Restricting to brands present in both runs of a pair (so set churn is removed), the rank agreement (Kendall τ) is only 0.64 (Claude), 0.66 (Copilot), 0.77 (Perplexity), against 1.0 for identical order. A "you moved from #4 to #2" claim sits on top of that noise even for brands that reliably appear.
The confidence intervals are the point, not a footnote. With 20 prompts × 3 repeats, the "same #1 pick" rate carries roughly a ±20-point band. A vendor reporting "you're the top recommendation 60% of the time" from a comparable sample is quoting a number whose error bars they've never shown you — because they've never disclosed the sample size.
One incidental finding worth noting: on the form-builder prompt, 2 of Claude's 3 runs returned no brands at all — the ungrounded model asked a clarifying question ("what will you mainly use it for?") instead of listing products. Neither grounded engine ever did this. For a tracker, these are true zeros that look like measurement failures, and a brand's presence rate quietly depends on how often the engine even chooses to answer.
Experiment 3 — does web grounding fix any of this?
A natural hypothesis fell out of the first two experiments: the consumer engines agreed with each other far more (mean cross-engine Jaccard ~0.41) than the raw API models did (0.09). Maybe grounding — live web search — pulls models toward the same review articles and stabilizes everything. If true, that would be a major finding: grounded trackers would be measuring something more real. So I tested it cleanly, with everything else held fixed: the same two models (gpt-5.5, gemini-3.5-flash), the same 20 prompts, web search toggled off vs on, same extractor across all four conditions. 160 calls, $6.72, zero errors.
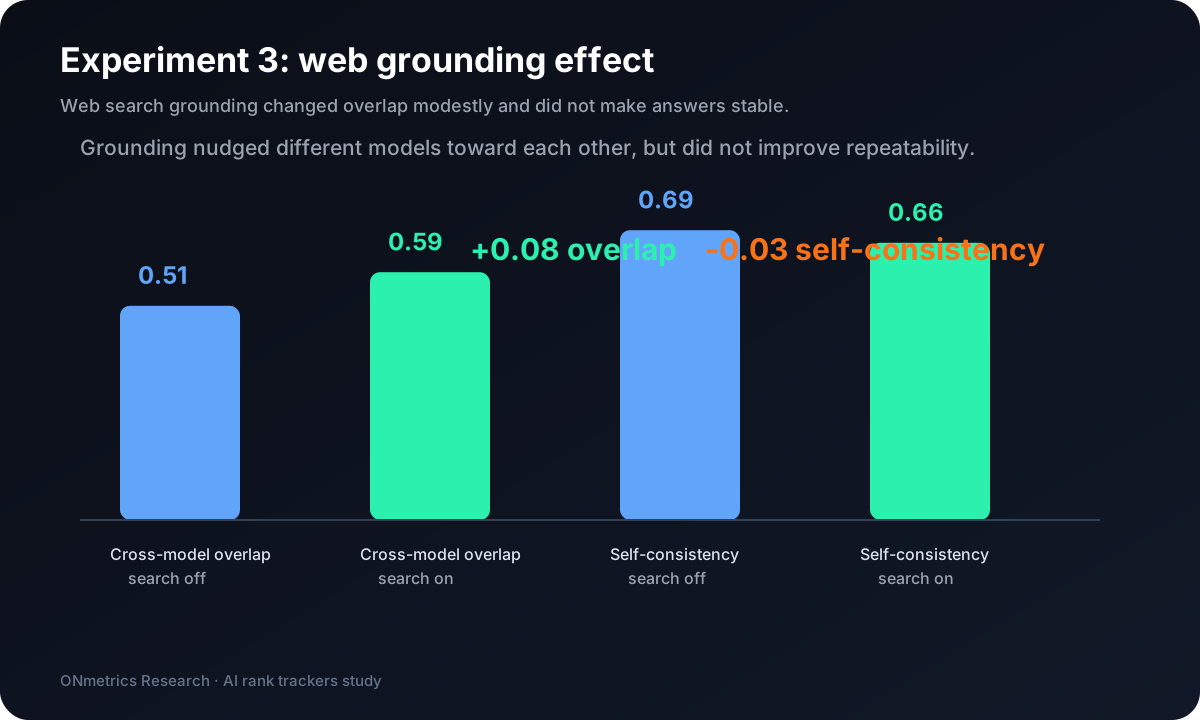
The answer is a careful "yes, but barely." Turning on web search reliably nudged the two models toward each other — cross-model overlap rose from 0.51 to 0.59, higher on 16 of 20 prompts (sign test p=0.012) — but the average shift was only about 0.08, far too small to make the engines interchangeable. And grounding did not make either model more self-consistent run-to-run (0.69 → 0.66, not significant).
This matters precisely because it's tempting to overclaim. The measured grounding effect (~0.08) is nowhere near large enough to explain the 0.41-vs-0.09 gap between the consumer engines and the raw API — so most of that gap is model identity and interface, not web search. The honest conclusion: grounding is a real but minor convergence force. The operational takeaway for a buyer is still sharp — two trackers hitting the same underlying model can report materially different share of voice based only on whether grounding was on, a knob most of them neither expose nor log.
Part 3 — Why this is genuinely hard (not just vendor laziness)
It would be unfair to blame all of the above on sloppy vendors. Measuring the inside of an answer engine is legitimately harder than classic rank tracking, for reasons baked into the medium — and an honest account has to say so:
- There is no "position 1–10." Answers are prose, not a ranked list of links. "Rank" has to be constructed — order of mention, prominence, recommendation strength — and every vendor constructs it differently, so their scores aren't comparable even in principle.
- The output is non-deterministic (Part 2), so any single measurement is a draw from a distribution, not a reading of a fixed value. Averaging requires many samples, which costs money the pricing model discourages.
- The systems change silently. Providers update model versions and system prompts frequently and without notice, which quietly breaks longitudinal comparisons.
- Consumer ≠ API. What you measure through the API often isn't what a user sees in the app, and the faithful path (consumer capture) is fragile and against terms of service.
- Grounding changes the regime. A grounded answer and an ungrounded one are different measurements, and mixing them without logging which is which pollutes the aggregate.
These are real constraints. But they are arguments for more disclosure about method, not less — a buyer who knows the sample size is 1 and the model version is unlogged can discount accordingly. The industry's failure is not that the problem is hard; it's that the difficulty is hidden.
Part 4 — The transparency problem, and why you can't audit around it
I profiled a dozen representative vendors on five basic methodological disclosures: sample size, model-version logging, whether grounded and ungrounded responses are separated, how the prompt set is built, and whether mentions are split from citations.
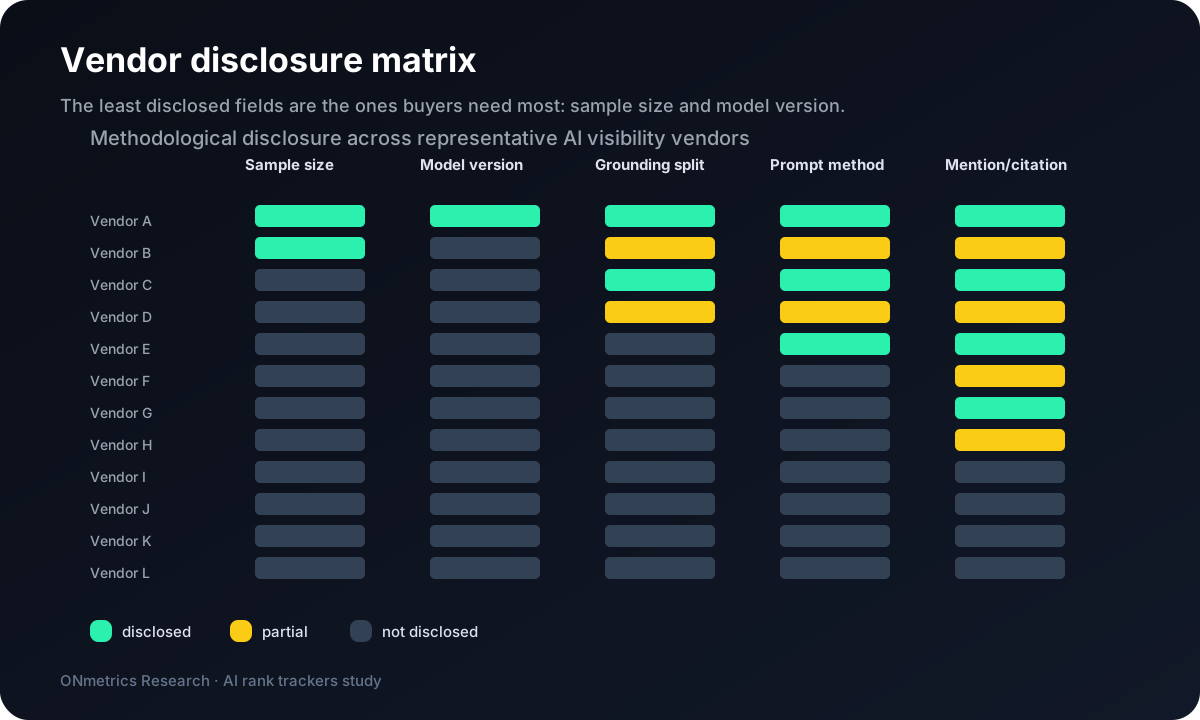
The pattern is stark. Sample size is disclosed by 2 of 12. Model-version logging by 1. Even the more transparent vendors — the ones that publish their scoring formula, like Peec and Evertune — still don't tell you how many times they sampled or which model version produced the number. The most-disclosed column is "mention vs. citation split," the least consequential of the five for trusting a headline score.
I then tried to get underneath the current marketing by pulling archived versions of vendor methodology pages from the Internet Archive, to trace how their claims had drifted over time. That failed in an instructive way: the pages are client-rendered single-page apps, and the quantitative claims render in JavaScript the Internet Archive doesn't capture. As a direct check, Peec's visibility-formula text ("the percentage of AI responses that mention your brand") appears in neither its December 2025 nor its May 2026 archived snapshot — both are empty 2–11 KB shells. So even the historical record of what these vendors claimed about their own methods is, in practice, unauditable. The only reliable way to hold a vendor's methodology to account is to screenshot the rendered page yourself, in the moment — which tells you a great deal about the state of the field.
It is worth noting what genuinely does exist as primary evidence, because the picture isn't uniformly opaque. Semrush's 10-K securities filing (an audited, legally accountable document) states plainly that its AI Optimization product lets customers "track, influence, and benchmark their brand's visibility and sentiment across AI-powered answer engines" 5. Patents are similarly revealing: BrightEdge holds a patent (WO2025175314A1, "Parsing search results") describing rendering a results page, waiting for AI content to load, then navigating and analyzing it — a textbook description of the consumer-capture architecture, filed and public 6. The disclosure exists; it just lives in filings and patents, not on the marketing pages where buyers look.
Part 5 — The optimization loop closes
Two developments turn all of this from an academic quibble into a structural problem. The first is that the loop the industry sells — measure visibility, then optimize it — is demonstrably closeable with techniques that have nothing to do with making a better product.
A 2025 academic testbed called E-GEO (Bagga, Farias, Korkotashvili, Peng & Wu, Columbia Digital Twins Lab) 7 took thousands of real product queries and tens of thousands of listings, used GPT-4o as an LLM judge, and searched for a "universal strategy" to raise a product's standing in AI answers. What it found: rewriting a product description to be longer, more persuasive, and more fluent — adding no new factual information — won against the original about 90% of the time, and the effect transferred across categories (roughly 88% on electronics, 87% on clothing). Earlier work pointed the same way: Kumar et al. (2024) on "strategic text sequences" and Pfrommer et al. (2024) on ranking manipulation 8.
The implication is uncomfortable. The signal these trackers measure can be moved by verbosity and persuasion — precisely the kind of content the "optimization" half of GEO sells. The loop closes on itself: the same techniques that game an answer engine are cheap, learnable, and don't require a better underlying product.
Part 6 — The scoreboard changes hands
The second structural development is the headline. In a single roughly twelve-month window 9:
- Adobe acquired Semrush for approximately $1.9 billion (announced Nov 2025, completed April 2026, delisting SEMR from the NYSE).
- Sitecore acquired Scrunch AI (~$225M estimated).
- HubSpot acquired XFunnel ("expanding AEO capabilities across its marketing tools").
The pattern is that the companies selling GEO optimization — content platforms, marketing suites, CMS vendors — are buying the companies that measure AI visibility. When the same firm both grades your AI visibility and sells you the service to improve it, the measurement's independence is structurally compromised, regardless of anyone's intentions.
Funding data underlines the direction. Analyst compilations put the "LLM monitoring" segment at roughly $227M raised across ~18 companies, with the category leader Profound alone having raised about $155M at a $1 billion valuation (Feb 2026) 13, and newer entrants like AirOps raising a $40M Series B at a $225M valuation 10. Roughly 73% of the tracking companies were founded in 2024 11, which means most of the "scoreboard" is younger than the behavior it claims to measure — and exactly the acquirable, dashboard-shaped size that this consolidation absorbs.
There is a caveat worth stating: the funding and market-share figures in this section come substantially from a venture-capital-authored dataset (Primo Capital) with an interest in the category's growth story, so they should be read as directional rather than audited. The consolidation events themselves, by contrast, are confirmed against company announcements and, for Semrush, an SEC filing.
Part 7 — What a buyer should actually do
Related ONmetrics guides
This study connects directly to AI services, data and attribution consulting, content marketing, and SEO strategy. For measurement context, pair it with revenue attribution for local businesses and marketing attribution models explained. For AI search risk, see AI search reputation risk and why content may not appear in AI Overviews.
The conclusion is not "don't use these tools." Used with the right skepticism, they're a reasonable directional signal — especially for the one thing that is stable, the top recommendation, and for spotting large shifts that exceed the noise band. But the numbers should be read like a scientist reads a measurement, not like a marketer reads a leaderboard. A working checklist:
Seer Interactive's ChatGPT 5.5 fan-out work adds one more thing to audit: the hidden subqueries an AI system runs before it writes the answer. If a model starts searching for a brand, author, or site-restricted query during the fan-out stage, the brand may be shaping the answer before the visible ranking even exists. That does not make AI rank-tracker scores more stable; it expands the measurement problem from final-answer visibility to fan-out visibility, co-citation, and source-path logging 16.
- Ask which sourcing architecture they use — consumer UI, base-model API, or public web. If they won't say, the number has no fixed referent, and it can't be compared to any other tool's number.
- Ask the sample size per prompt. If it's one, or a handful, treat presence rates as rough and ignore small week-to-week "trends" — they're inside the noise band. Ask for a confidence interval; if there isn't one, the vendor doesn't know their own error bars.
- Ask whether they log model version and grounding state. Both silently change the answer, and an unlogged model update can masquerade as a real trend in your score.
- Ask whether they expose fan-outs or grounding queries. A final answer is downstream of hidden searches, rewritten prompts, and source-selection steps. If the vendor cannot show the path into the answer, it is only measuring the last frame of the process.
- Trust the top pick; discount the ranking. The #1 recommendation carries real signal. Positions 2–10 and their week-over-week wiggles are mostly sampling noise; about a third of the brands in any single report wouldn't reappear on a re-run.
- Separate mentions from citations. They have different causes and different fixes — being named in the text and being linked as a source are not the same visibility.
- Check for the conflict of interest. If the vendor also sells the optimization service (increasingly likely after the 2025–26 consolidation), the measurement and the remedy come from the same party. That's not disqualifying, but it's a reason to verify claims independently.
The bottom line
The AI-visibility industry is measuring something real. Brand discovery has genuinely moved inside answer engines, and a company that ignores it is flying blind on a channel that increasingly shapes purchase decisions. Pretending the category is worthless would be as wrong as trusting its dashboards uncritically.
But what it measures is an unstable, engine-specific, access-path-dependent distribution — and it compresses that distribution into a single confident number, using methods it largely won't disclose, while the firms doing the measuring are being bought by the firms selling the fix.
Three independent measurement paths — a published 3,000-prompt study, my 400-call API experiment, and my 180-run consumer study — agree on the core fact: the identical answer essentially never recurs, and about a third of what these tools report is single-run noise. The one honest signal is the top recommendation. Everything past it deserves an error bar the dashboards don't draw.
The scoreboard is being bought by the players — and, for now, almost nobody can read how it keeps score.
Methodology & provenance
This article is the standalone summary of a longer research working paper. The paper is backed by a 77-source annotated library that prefers primary sources — SEC filings, patents, vendor technical documentation, and peer-reviewed papers — over marketing pages, which are used only for feature-existence claims, never for methodology validity. The source notes below distinguish primary-source verification, credible reporting, and ONmetrics inference, and conflicts between sources (for example, competing claims about what fraction of AI-cited links come from outside the top organic results) are presented rather than resolved away.
The three original experiments total 740 live model calls: a 400-call API non-determinism test (gpt-5.5 + gemini-3.5-flash, ungrounded), a 180-run manual multi-engine study (Claude / Perplexity / Copilot, with bootstrap confidence intervals, brand-churn, power analysis, and Kendall-τ rank agreement), and a 160-call controlled grounding experiment (same two models, web search off vs on). Raw responses, extractions, and metrics for all three ship with the report.
One honest limitation. The consumer study used LLM-judgment brand extraction, while the two API experiments used a fixed-dictionary extractor (a mid-session compute limit forced the switch). Within each experiment the extraction method is uniform, so every contrast reported here is valid; but absolute overlap levels are not compared across the two methods, which is why the API and consumer results are reported on their own footings rather than merged into a single cross-engine table.
Recency. Market size, funding, valuations, the vendor roster, and the acquisition figures are accurate as of mid-2026 and will age faster than anything else here. The methodology analysis — the pipeline, the non-determinism, the disclosure gaps — is the durable contribution, and it will outlast this particular snapshot of the market.
Sources and resources
- Primo Capital / analyst dataset. Used as directional market context for vendor count, category funding, and market formation rather than as audited market data.
- Vendor technical documentation from Conductor, Profound, Ahrefs, and related AI visibility products. Used to distinguish consumer-capture, API, and public-web measurement architectures.
- Published product documentation and feature descriptions from AI visibility vendors. Used for prompt-set construction patterns and feature-existence claims.
- Vendor methodology pages available in mid-2026. Used where a platform disclosed enough scoring detail to compare weighting logic.
- SEC filing evidence. Used for legally accountable acquisition and product-description claims.
- Published patent evidence. Used for the consumer-results capture architecture described in BrightEdge WO2025175314A1.
- Academic preprint evidence: E-GEO, arXiv 2511.20867. Used for optimization-transfer and LLM-judged product-ranking claims.
- Secondary-source citation trail. Used only to note adjacent work where the original abstracts were not independently fetched during this pass.
- Company announcements and SEC filings available by mid-2026. Used for consolidation events and acquisition timing.
- Search-result headline evidence only. Used as a weaker directional note for funding details that should be rechecked before being treated as definitive.
- Analyst dataset evidence. Used directionally for category composition and founding-year mix.
- ONmetrics inference from the evidence pattern. Used where the article draws a conclusion from primary sources, vendor behavior, and experiment results rather than quoting a single source.
- Primary-source-backed claim in the research library, including academic papers, filings, patents, vendor documentation, or original experiment outputs.
- Credible secondary reporting or third-party analysis. Used as context, not as audited source material.
- Search Engine Land / Fractl, "What 1 million keywords reveal about AI's impact on search," published July 2, 2026. Used for demand-shift context, non-branded-query vulnerability, and consumer behavior around AI recommendations. URL: https://searchengineland.com/what-1-million-keywords-reveal-about-ais-impact-on-search-481474
- Seer Interactive, Wil Reynolds and Nick Haigler, "The Proof: ChatGPT 5.5's fanout patterns reveal the importance of brand," published June 25, 2026. Used for fan-out visibility, brand-bearing subqueries, and co-citation as an additional measurement surface. URL: https://www.seerinteractive.com/insights/the-proof-chatgpt-5.5s-fanout-patterns-reveal-the-importance-of-brand
Need to turn this into a measurement plan?
ONmetrics helps businesses separate useful AI visibility signals from noisy dashboard movement, then connect search, content, attribution, and lead quality to business outcomes.