
London building permits cooled, but housing growth stayed uneven.
The headline number says construction cooled in 2025. The neighbourhood data says growth pressure is still real, but concentrated. That matters because demand, competition, search behaviour, and lead opportunity do not move evenly across the region.
- Total permit value, 2025: $3.12B
- Total permit value, 2024: $3.76B
- Year-over-year change 2024→2025: -16.9%
- Residential share of 2025 value: 64%
- Non-residential share of 2025 value: 36%
- New residential dwelling units, 2025: 5,752
- — single-detached: 435 (8%)
- — apartment: 4,405 (77%)
- Total permit value, 2021–2025 (5 yr): $13.3B
- New dwelling units, 2021–2025 (5 yr): 21,459
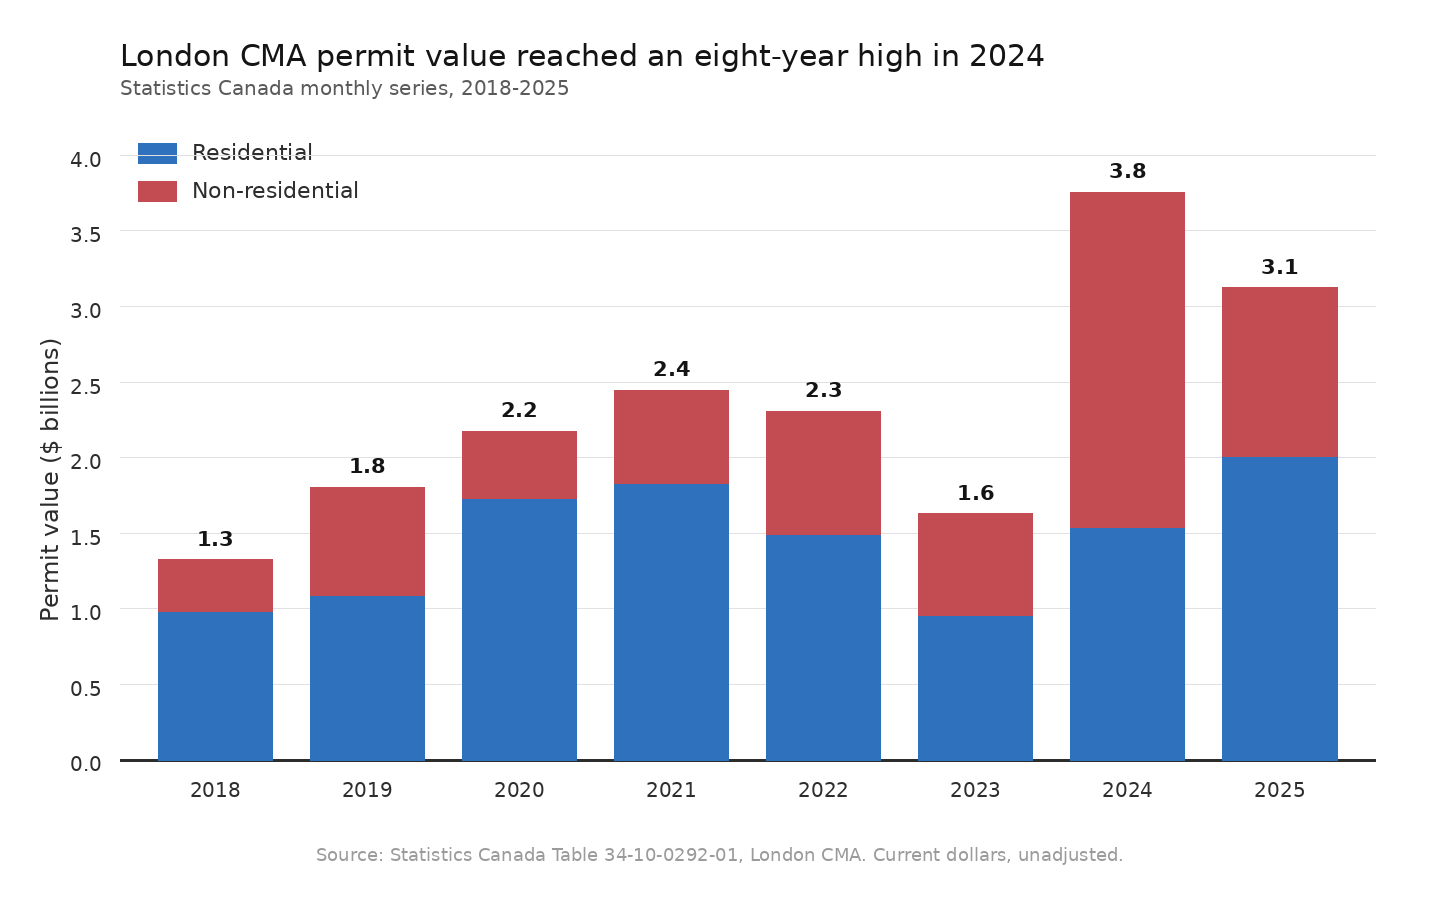
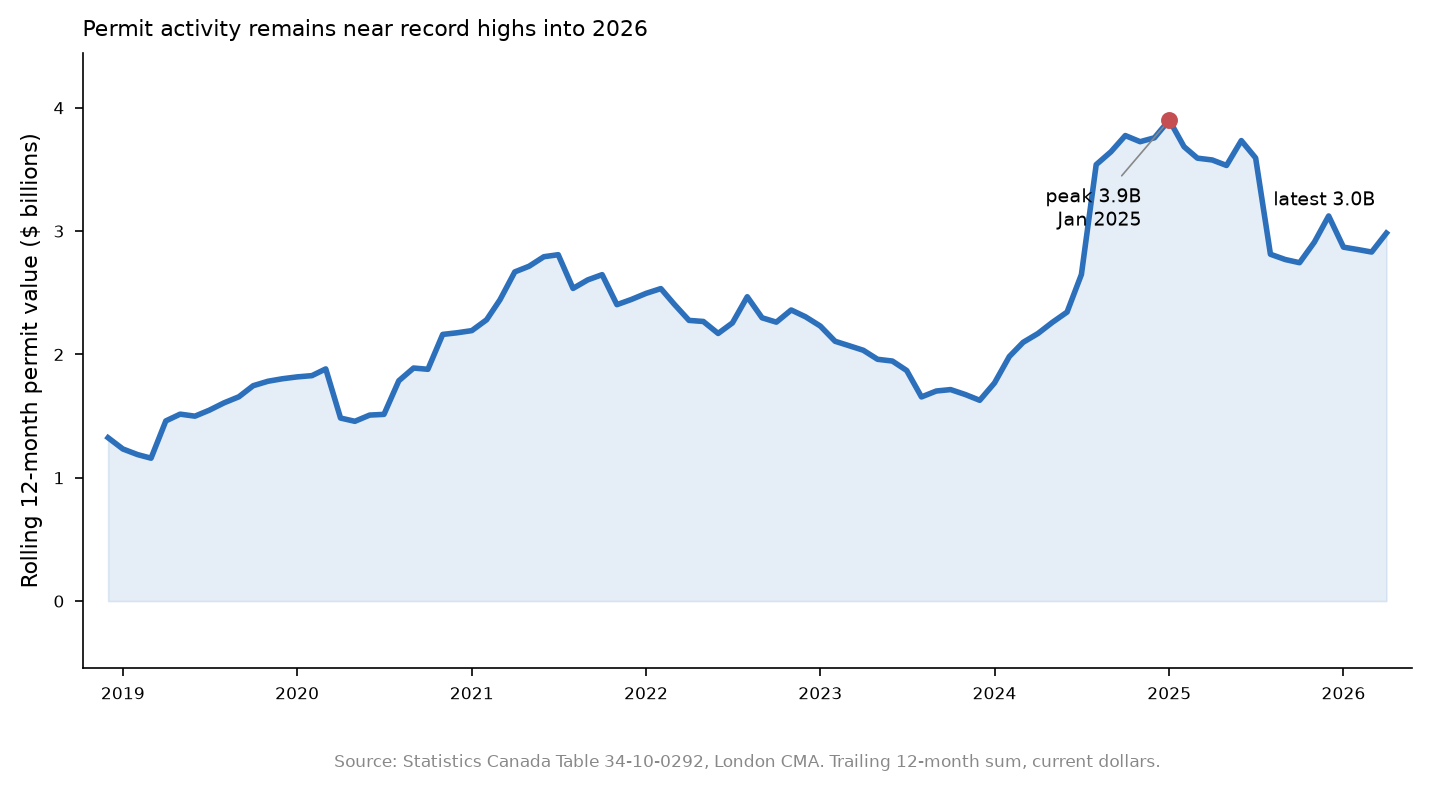
London building permit value fell from an eight-year high.
The London CMA had $3.12B in total permit value in 2025, down from $3.76B in 2024, the highest year in the available monthly series since 2018. In 2024, non-residential permit value ($2.22B) exceeded residential permit value ($1.54B). Residential permits represented 64% of the 2025 permit value.
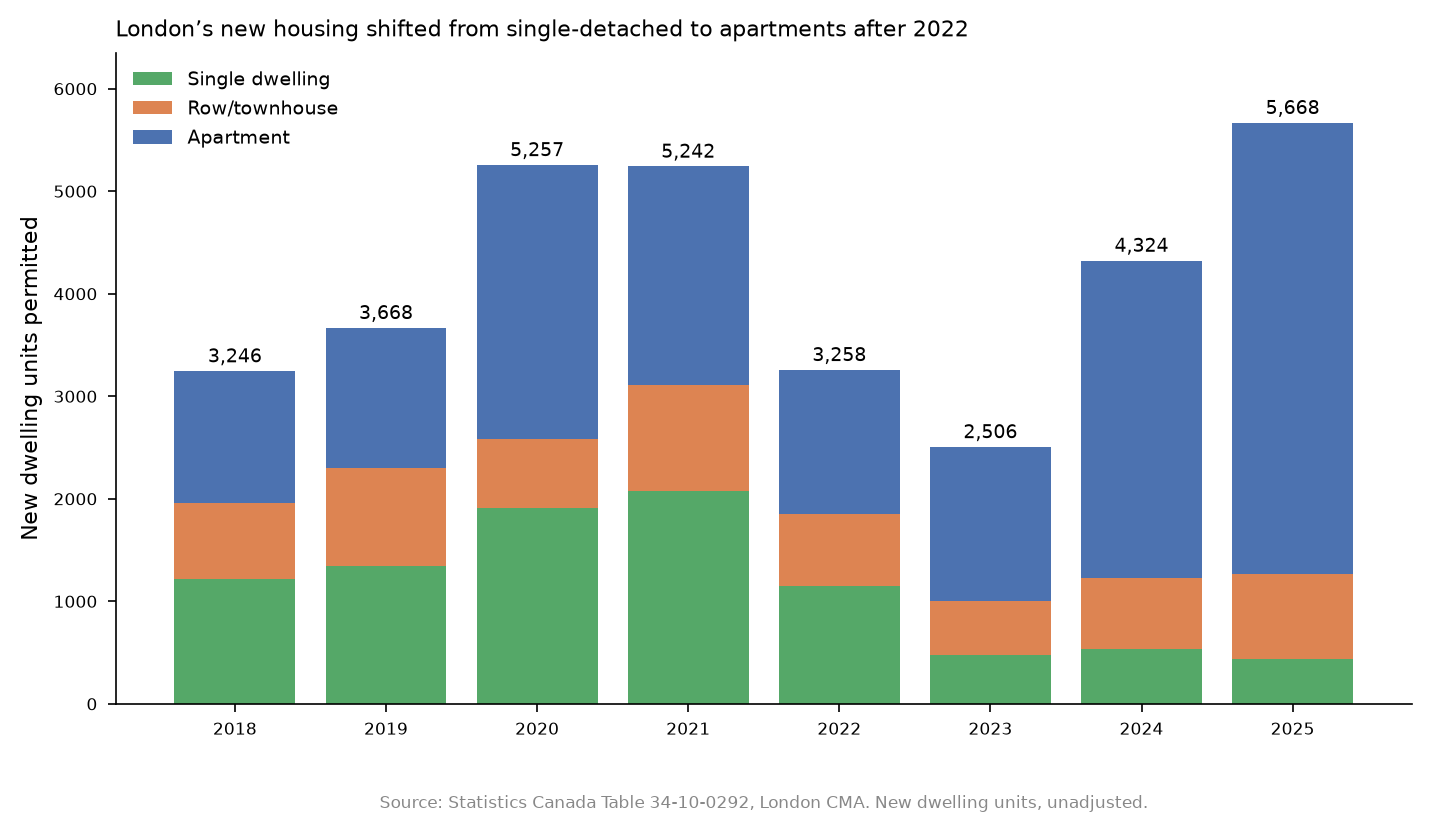
Apartments dominate new residential units.
The London CMA added 5,752 new residential dwelling units in 2025. Apartments accounted for 4,405 units, or 77% of the new unit count; single-detached homes accounted for 435 units, or 8%. Compared with 2021, apartment units doubled from 2,129 to 4,405, while single-detached units fell 79% from 2,077 to 435. The single-detached drop is not a partial-year artifact: 2025 is a complete 12-month year, and the annual sequence is 2,077 in 2021, then 1,145, 473, 533, and 435.
Neighbourhood-level growth is concentrated.
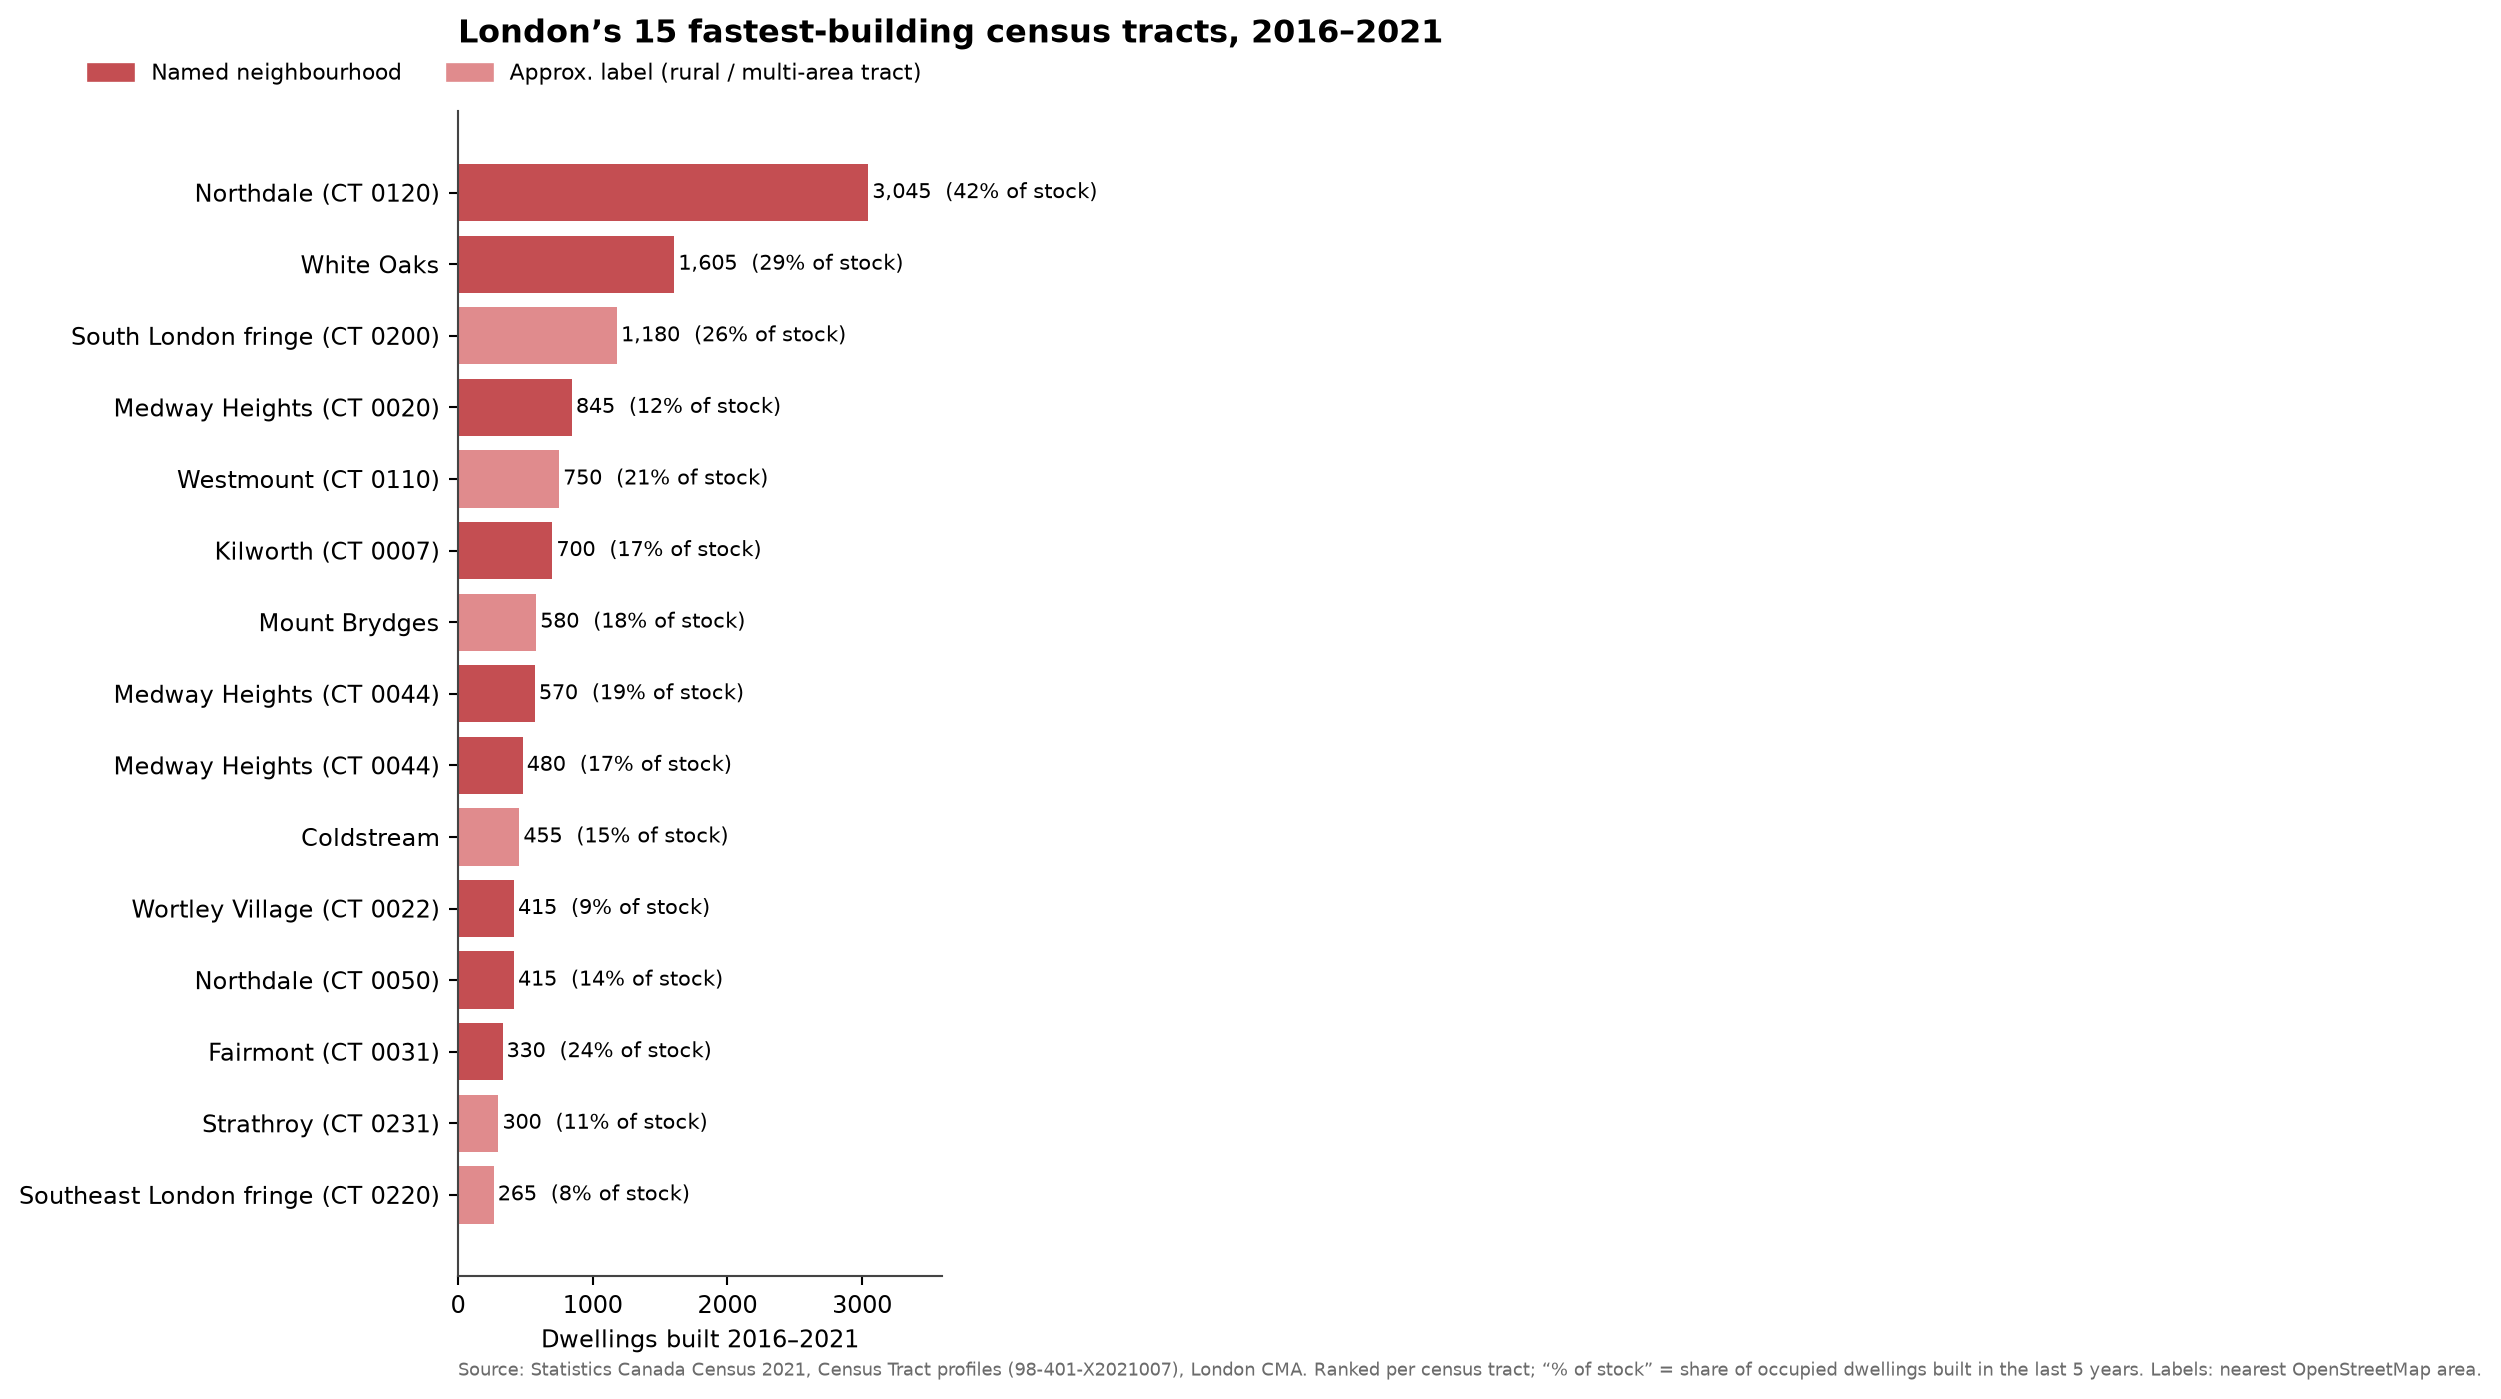
The census tract data shows a much sharper picture than the regional totals. The top 5 tracts accounted for 7,425 new homes from 2016-2021, or 47% of the London CMA total in this dataset.
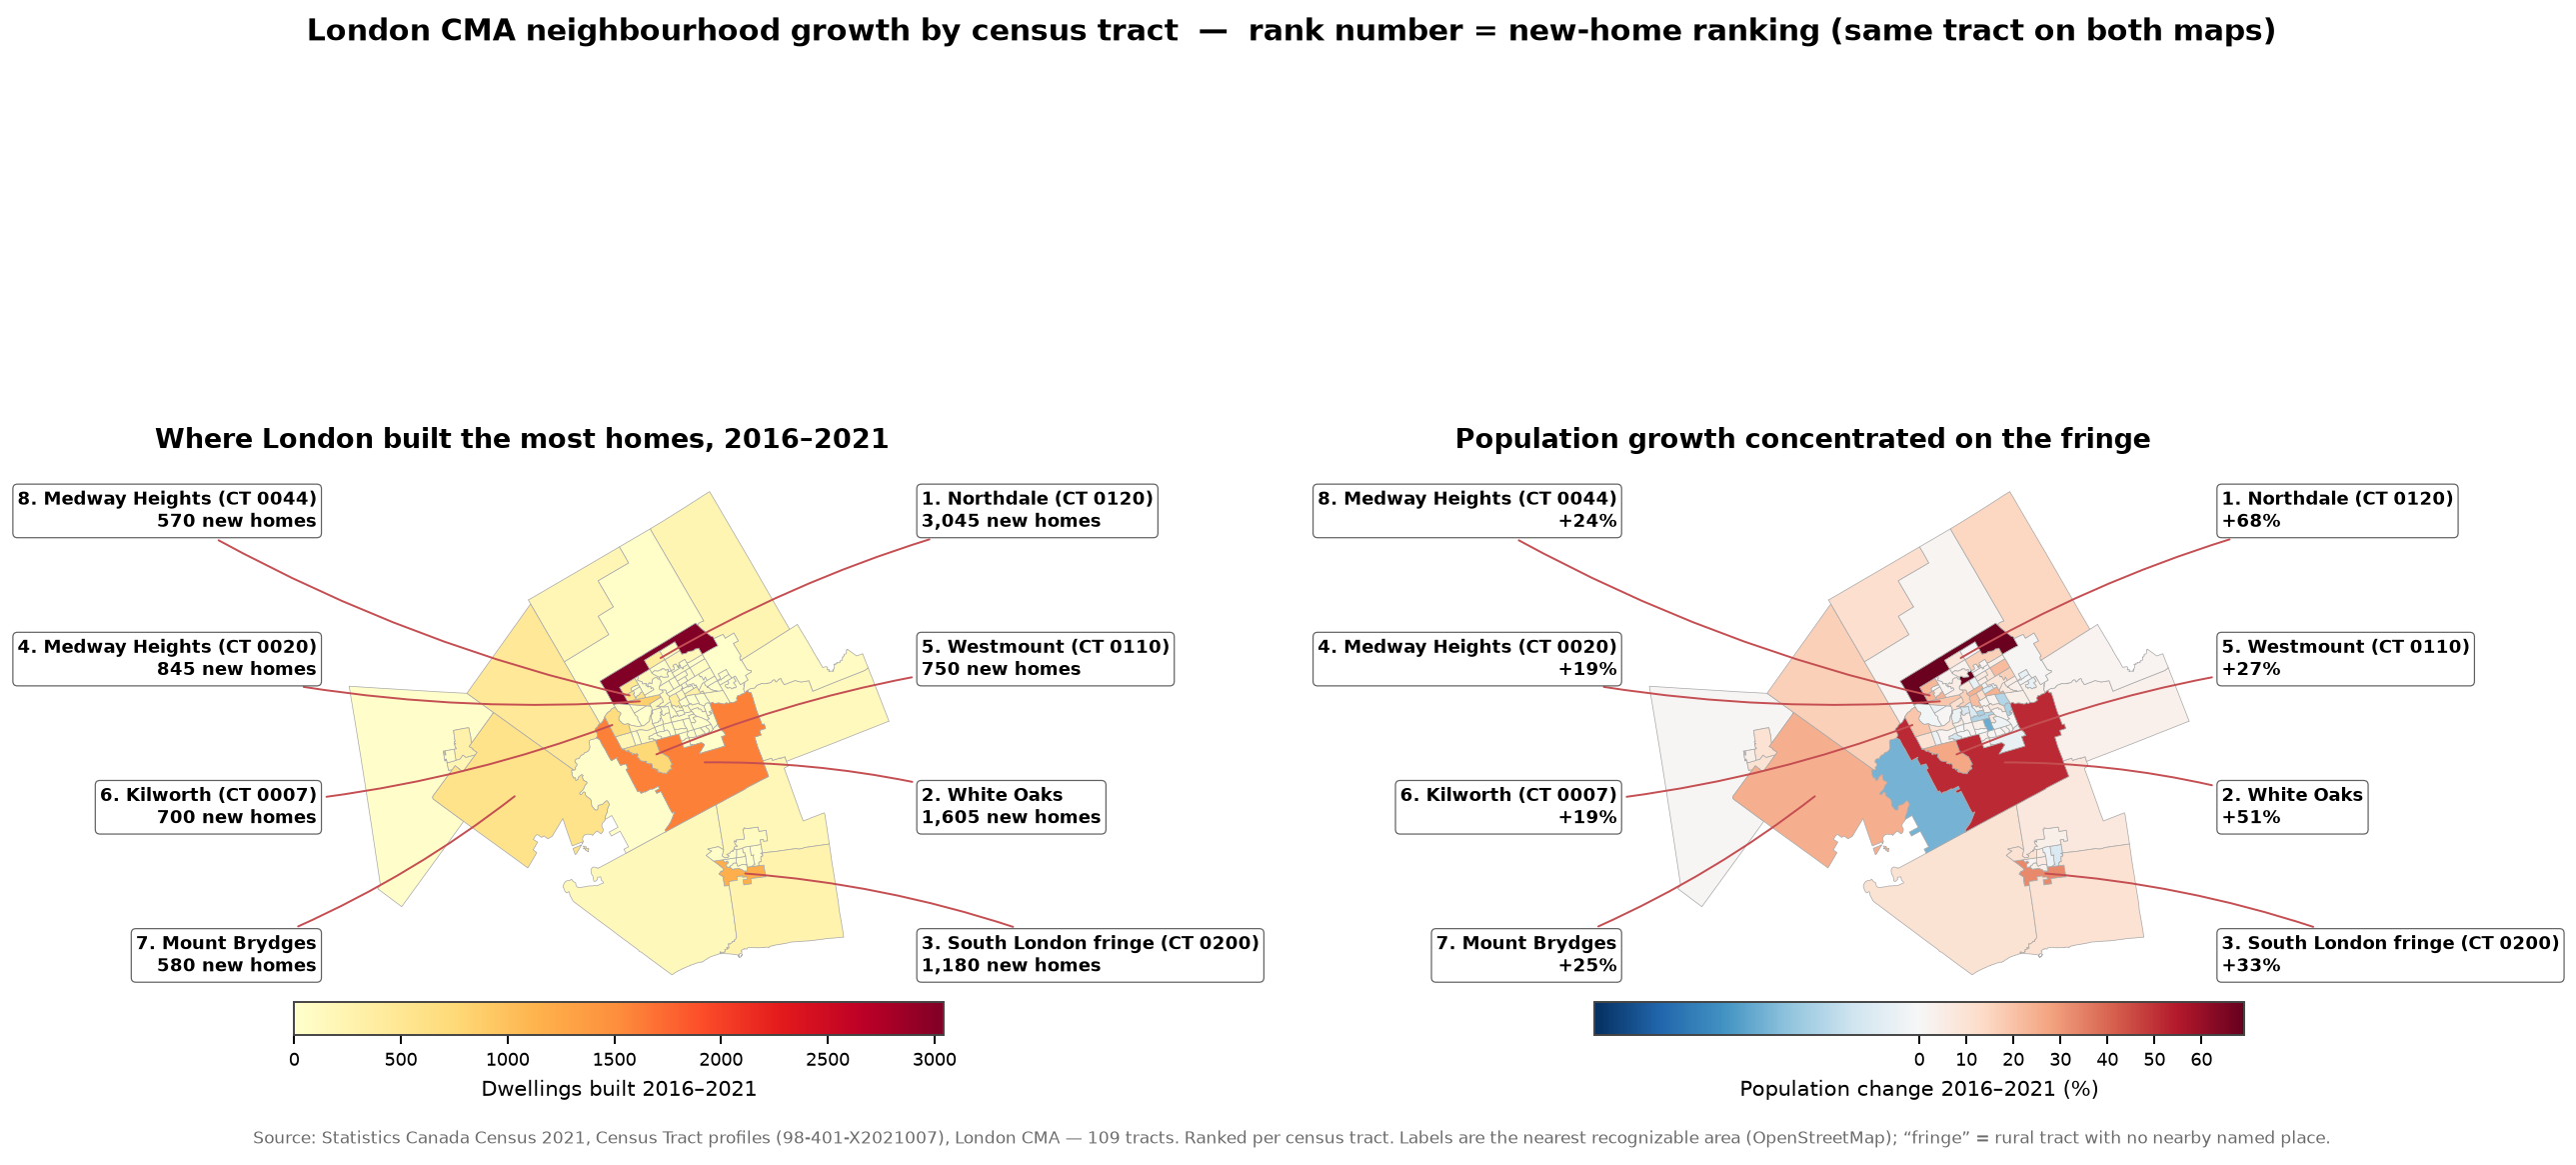
Northdale and White Oaks lead the ranking.
Fastest-growing signals
Northdale (CT 0120) added 3,045 homes, grew 68.3% in population from 2016-2021, and had new homes equal to 41.8% of 2021 dwelling stock. White Oaks added 1,605 homes and grew 51.3%.
Naming note: area labels are practical reference labels for census tracts, not official municipal neighbourhood boundaries. good means the tract is close to a recognizable local place name; approx. means a rural/fringe tract is labelled by directional context or nearest named place. Use the census tract ID for exact geography.
| Rank | Area label* | Tract | New dwellings | Pop. change | New stock | Label quality* |
|---|---|---|---|---|---|---|
| 1 | Northdale (CT 0120) | 5550120.03 | 3045 | 68.3% | 41.8% | good |
| 2 | White Oaks | 5550110.02 | 1605 | 51.3% | 29.1% | good |
| 3 | South London fringe (CT 0200) | 5550200.00 | 1180 | 33.1% | 25.6% | approx. |
| 4 | Medway Heights (CT 0020) | 5550020.02 | 845 | 19.3% | 12.1% | good |
| 5 | Westmount (CT 0110) | 5550110.01 | 750 | 27.0% | 21.2% | approx. |
| 6 | Kilworth (CT 0007) | 5550007.01 | 700 | 19.2% | 17.0% | good |
| 7 | Mount Brydges | 5550234.00 | 580 | 24.9% | 17.7% | approx. |
| 8 | Medway Heights (CT 0044) | 5550044.06 | 570 | 24.1% | 18.9% | good |
| 9 | Medway Heights (CT 0044) | 5550044.05 | 480 | 23.0% | 16.6% | good |
| 10 | Coldstream | 5550150.00 | 455 | 16.2% | 14.8% | approx. |
How local businesses can use this.
SEO
Fast-growing areas can justify neighbourhood modifiers, local SEO service pages, and refreshes to pages that already capture London search demand.
Google Ads
Growth areas may deserve location testing, campaign splits, or landing page variants if search volume and lead quality support the move. Tie this back to small-business Google Ads planning.
Google Business Profile
Service-area businesses should watch how proximity, review competition, and map-pack behaviour change around growing corridors.
Attribution
New-area traffic only matters if it becomes qualified calls, form fills, booked jobs, and revenue. Revenue attribution for local businesses should confirm whether the demand is real.
Sources and limitations.
Permit values and dwelling-unit counts use Statistics Canada Table 34-10-0292-01 for the London CMA, with monthly data from January 2018 onward and 2025 treated as a complete 12-month year. Neighbourhood growth uses Statistics Canada 2021 Census Profile data and London-area census tract boundary files. Permit values can refresh annually; neighbourhood construction and growth should refresh when relevant 2026 Census data becomes available.
Naming convention: census tracts are approximate local-market signals, not exact neighbourhood boundaries. Area labels are operational labels for market analysis, not official City of London, municipal, or Statistics Canada neighbourhood names. Labels marked approx. are rural or fringe tracts assigned by directional context or the nearest named place; labels marked good are closer matches to recognizable local place names. Census tract IDs are included for precision and should be used when exact geography matters.
Permit values and dwelling-unit counts are approvals/permitted units, not completed construction. Census dwelling counts are used when describing homes built in 2016-2021.
Download the source files.
Primary source citations
- Statistics Canada. Table 34-10-0292-01: Building permits, by type of structure and type of work. DOI: 10.25318/3410029201-eng.
- Statistics Canada. Census Profile, 2021: Census metropolitan areas, tracted census agglomerations and census tracts, catalogue 98-401-X2021007.
- Statistics Canada. 2021 Census boundary files, census tract boundaries used for geographic joins.
To cite this ONmetrics analysis: ONmetrics Research. London Ontario Building Permits and Housing Growth Tracker. Published July 2, 2026. https://on-metrics.com/research/london-development-tracker/